Cackalacky2.0
Specimen
- Messages
- 9,023
- Reaction score
- 8,022
Stay strong my man.Interesting data, still won't take the vax though!
")

Stay strong my man.Interesting data, still won't take the vax though!
Stay strong my man.
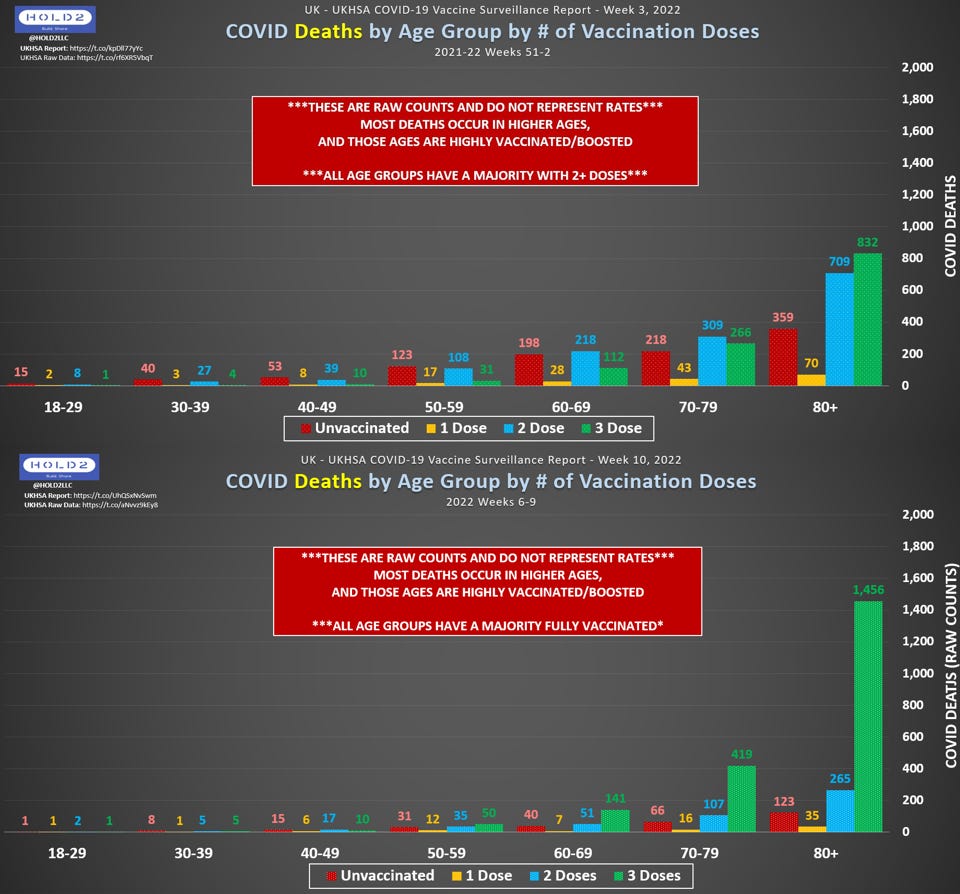
Okay, here you go. We have to use UK data because CDC doesn't post raw numbers (why not?)
You use a lot of statistical analysis 101 words, but still no studies to support that vaccines aren't effective. At some point the onus is on you to provide backup to your point.
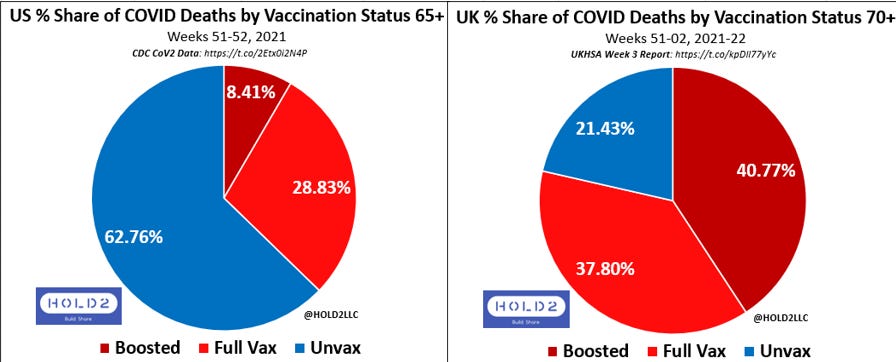
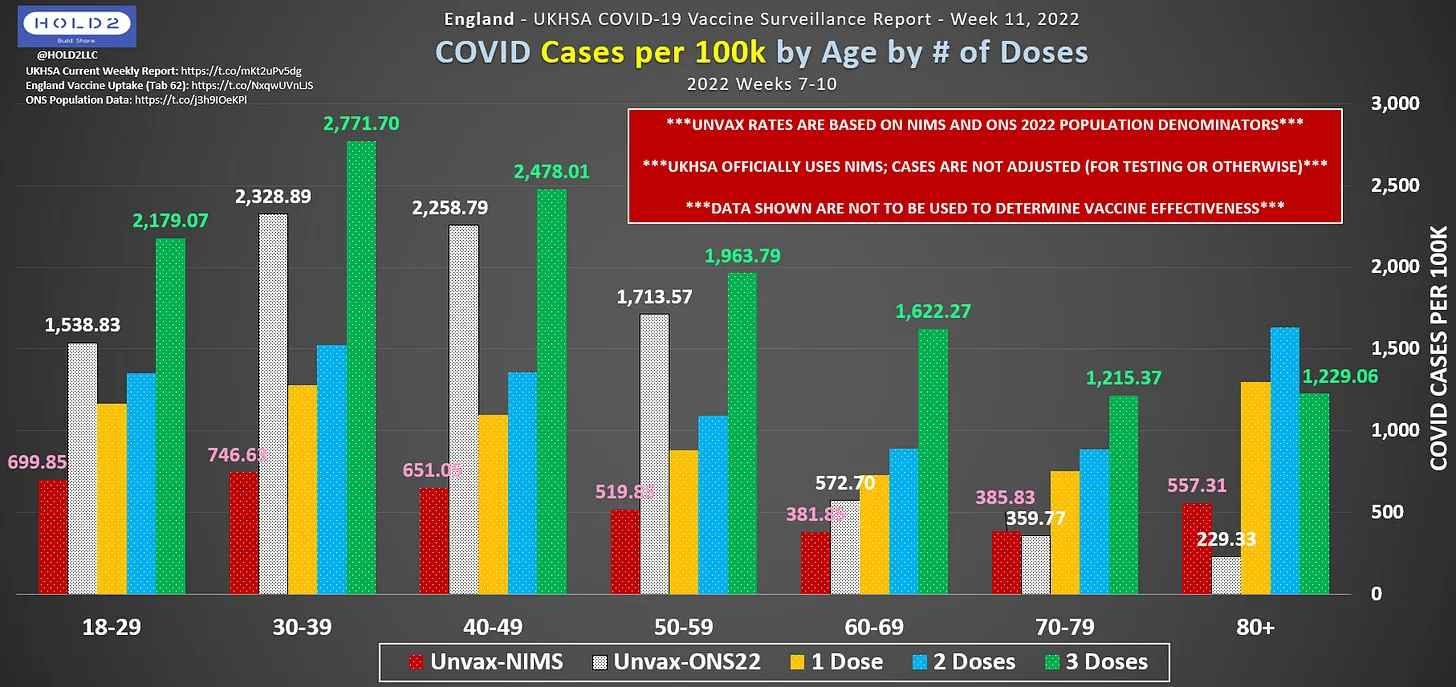
Since your post was from March 2022, first chart regarding cases %. Unvax had higher shares of reported cases than all other vax statuses. Having a higher share of the cases being unvaxxed is.....not good.Okay, here you go. We have to use UK data because CDC doesn't post raw numbers (why not?)
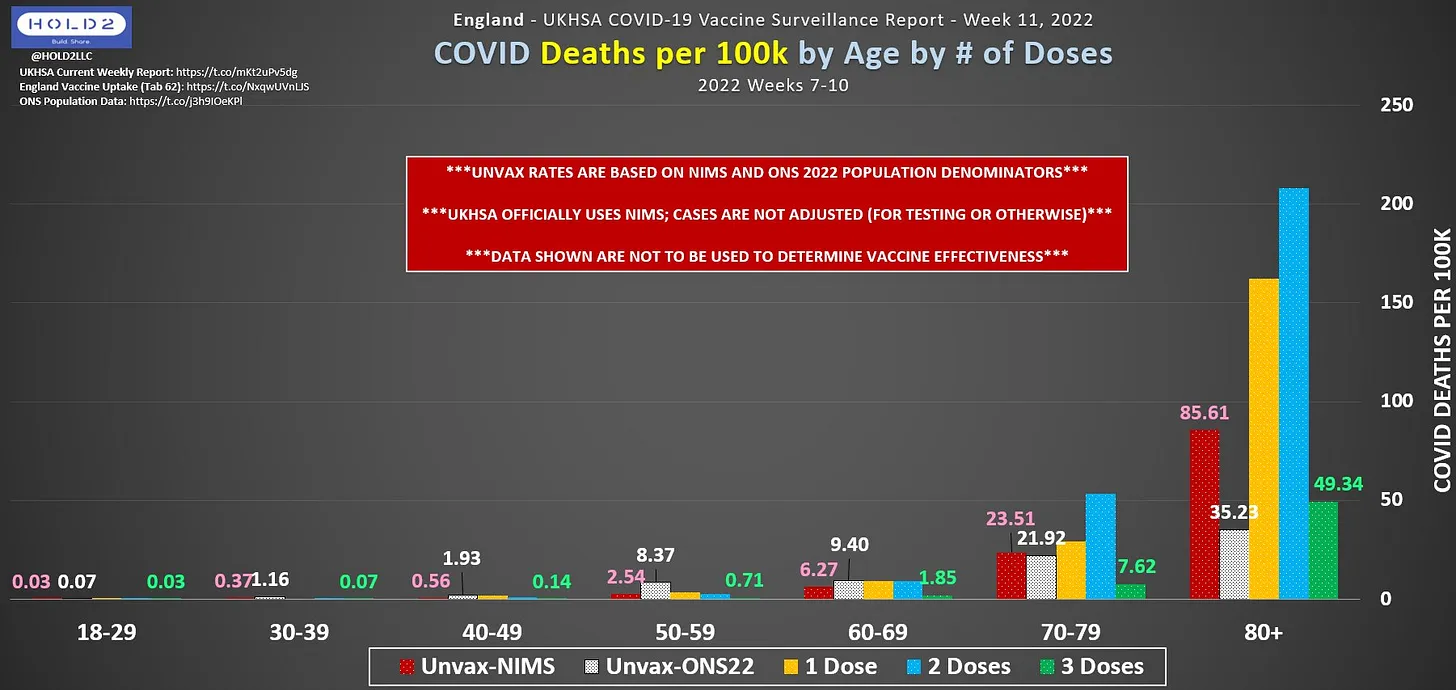
Pay attention to the case, hospitalization, and death rate data stratified by age about halfway down.

Exactly. The chart, while semi-interesting is nearly useless in providing anything meaningful in which to draw any conclusions. I'm extremely curious what reputable source Cack pulled this information from. The States with the highest overall COVID death counts are almost entirely made up of states with high prevalence of underlying health conditions AND/OR states with higher than typical 65+ individuals.Using Florida as a barometer for COVID is a bit of cherrypicking. We know that 9 out of 10 COVID deaths are from people 50 and older. Florida's average age is also 6 years higher than other states like New York. It's probably one of the highest destination states for retirement, if not the highest. Regardless they remain #3 in total deaths overall behind California and Texas respectively, which makes sense given the fact Florida is #3 in population among the states. Viruses gonna virus.

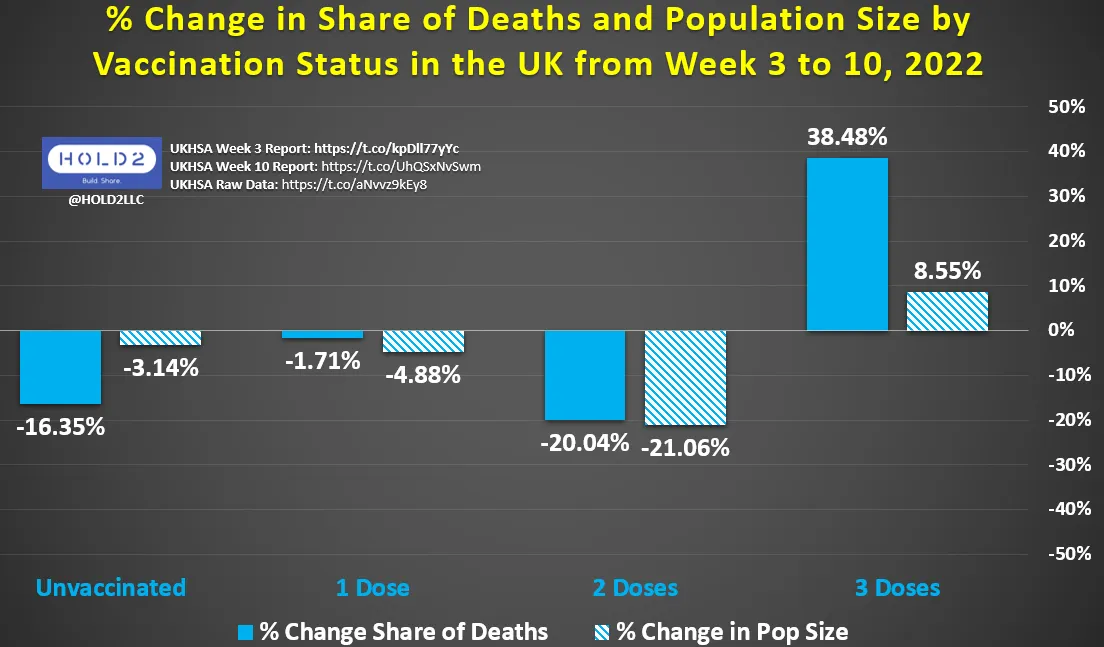
Remember, the UK stopped posting raw data in March 2022 because the stats were looking so bad and government officials decided to stop it. And no other nation provides this raw data, so it's the still one of the best datasets we can use.Since your post was from March 2022, first chart regarding cases %. Unvax had higher shares of reported cases than all other vax statuses. Having a higher share of the cases being unvaxxed is.....not good.
View attachment 3051626
Remember, the UK stopped posting raw data in March 2022 because the stats were looking so bad and government officials decided to stop it. And no other nation provides this raw data, so it's the still one of the best datasets we can use.
And I thought case rates didn't matter, only hospitization and death rates? At least that's what the vax proponents have been saying ever since vaxxed case rates exploded. So which is it?
There are other risks by taking the vaccine in the younger crowd. If you're high risk it certainly makes sense to take the shot, but for the under 40 crowd there's other considerations now:You know how rate stats work, no?
Unvaxxed people represented a larger proportional share of the COVID cases than what they are represented by in terms of the split between unvaxxed and vaccinated people.
Take a look at this big government conspiracy website - https://coronavirus.data.gov.uk/details/vaccinations
Why people can't just say "I don't want to take it and I accept the risks of not taking it" instead of just embarrassing themselves. It's like convincing people that actually wearing a helmet on a bike is more problematic than not wearing one. If the vaccine was actually a government ploy to kill us all I'd rather be dead than exist in the horsepaste world post COIVD lmao.
 www.floridahealth.gov
Today, State Surgeon General Dr. Joseph A. Ladapo has announced new guidance regarding mRNA vaccines. The Florida Department of Health (Department) conducted ananalysis through a self-controlled case series, which is a technique originally developed to evaluate vaccine safety.
This analysis found that there is an 84% increase in the relative incidence of cardiac-related death among males 18-39 years old within 28 days following mRNA vaccination. With a high level of global immunity to COVID-19, the benefit of vaccination is likely outweighed by this abnormally high risk of cardiac-related death among men in this age group. Non-mRNA vaccines were not found to have these increased risks.
As such, the State Surgeon General recommends against males aged 18 to 39 from receiving mRNA COVID-19 vaccines. Those with preexisting cardiac conditions, such as myocarditis and pericarditis, should take particular caution when making this decision.
So, is not getting the jab now considered anti-science?Again, this is the cultural Science/Anti-Science split.
Politics is a secondary issue. ... but fine, get angry about politics --- seems weirdly to translate hatred into strange pleasures.
I, as all know, am an old (retired) science professor, so I have my severe bias against the Anti-Science crowd.
Some important context from the study in the article.There are other risks by taking the vaccine in the younger crowd. If you're high risk it certainly makes sense to take the shot, but for the under 40 crowd there's other considerations now:
News - Florida Department of Health
The Florida Department of Health is warning Floridians about the serious health risks associated with 7-hydroxymitragynine (7-OH) and its derivatives, potent opioid-like compounds that are increasingly being marketed and sold throughout Florida.
Additionally, significant mortality from diagnosed COVID-19 infection occurred among all adult age groups.
This study cannot determine the causative nature of a participant’s death. We used death certificate data and not medical records. COVID testing status was unknown for those who did not die of/with COVID. Cardiac-related deaths were ascertained if an ACME code of I3-I52 were on their death certificate, thus, the underlying cause of death may not be cardiac-related.
While this method has been used to assess risk of death following COVID-19 vaccination,2 it violates the assumption that an event does not affect subsequent exposure (for mRNA vaccines), which may introduce bias. 6 Further, it does not consider the multidose vaccination schedule required for mRNA vaccination.
You know how rate stats work, no?
Unvaxxed people represented a larger proportional share of the COVID cases than what they are represented by in terms of the split between unvaxxed and vaccinated people.
Take a look at this big government conspiracy website - https://coronavirus.data.gov.uk/details/vaccinations
Why people can't just say "I don't want to take it and I accept the risks of not taking it" instead of just embarrassing themselves. It's like convincing people that actually wearing a helmet on a bike is more problematic than not wearing one. If the vaccine was actually a government ploy to kill us all I'd rather be dead than exist in the horsepaste world post COIVD lmao.
Why people can't just say "I don't want to take it and I accept the risks of not taking it".
Virus gonna virus. Virology 101: viruses get less deadly over time; viruses only want to multiply - can't do that if they kill their host.Why has the mortality rate decreased yet there are stronger variants? What nifty invention has lead to that?
Why has the mortality rate decreased yet there are stronger variants? What nifty invention has lead to that?
Oops yes that's right, my point was more to when Delta was dominant and vaccines helped with that...before omicron came and dusted everyone.Per the CDC, this is not accurate. Omicron became significantly less severe as a cost of its easier spread. I agree that vaccination and prior infection are part of this, but it is also just a more mild version. Shorter hospital stays and lower morality rate for unvaccinated cohorts compared to Delta. The problem that we may see again this winter is because of how rapid it can spread, you will see similar strains on EDs especially now that everyone has returned to normal life.
You know how rate stats work, no?
Unvaxxed people represented a larger proportional share of the COVID cases than what they are represented by in terms of the split between unvaxxed and vaccinated people.
Take a look at this big government conspiracy website - https://coronavirus.data.gov.uk/details/vaccinations
Why people can't just say "I don't want to take it and I accept the risks of not taking it" instead of just embarrassing themselves. It's like convincing people that actually wearing a helmet on a bike is more problematic than not wearing one. If the vaccine was actually a government ploy to kill us all I'd rather be dead than exist in the horsepaste world post COIVD lmao.
Oops yes that's right, my point was more to when Delta was dominant and vaccines helped with that...before omicron came and dusted everyone.
Ok, I'll hold your hand here.Still looking forward to your answers to my questions.


Ok, I'll hold your hand here.
1. First chart - shows vaccine coverage in the UK
View attachment 3051633
Ok lets take the average of the 4 countries - 91.5% have at least 1 dose.
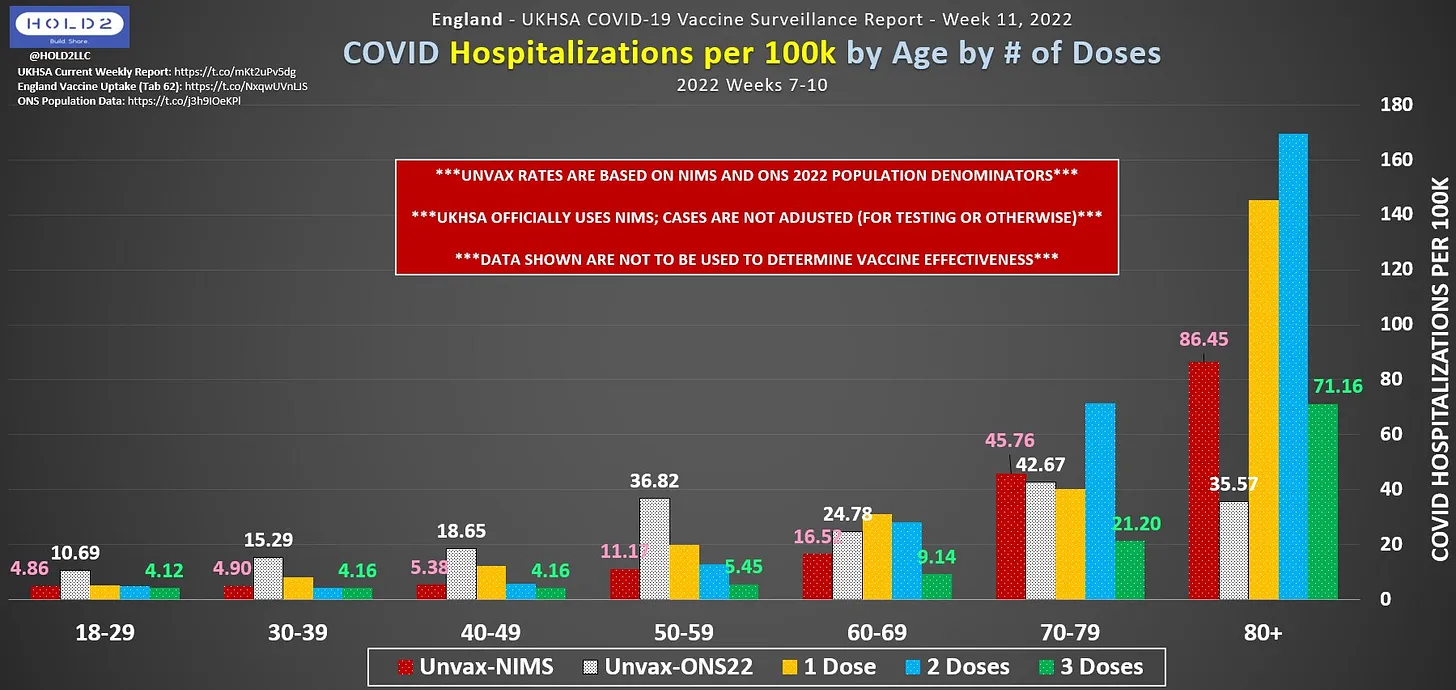
2. Your chart on hospitalizations
View attachment 3051634
18-29 cohort = assigned a value of 4.86 for blue and yellow, therefore total per 100k is 29.39. 4.86/29.39 = 16.53%. So it is basically twice as high as the share of the population that is unvaccinated (8.5%) at the lowest risk cohort. Maybe the highest cohort with coverage the 80+ group? Ok, so the total per 100k is 86.45+ ~142 + ~170 + 71.16 = 469.61 therefore unvaccinated accounts for 18.40%. The vaccine coverage is likely higher than 91.5% for that cohort.
So - even at the lowest risk cohort the vaccine is doing a better job than unvaccinated people, at the highest risk? It clowns it.
That's your introductory course in why proportional share matters. Do you need the cases/deaths explained too?
That was Mrs. Irish Steelhead, not a dude.Saw a dude this weekend wearing a mask while riding his motorcycle around - without a helmet
He probably just got creative and wanted something to keep the bugs from flying into his mouth.Saw a dude this weekend wearing a mask while riding his motorcycle around - without a helmet.
You are misinterpreting the data. These rates are total hospitalizations divided by total population size - adjusted to a common denominator, hence the per 100k. It already accounts for population share.
For the 18-29 cohort:
There are 4.86 hospitalizations for every 100k unvaxxed. This has nothing to do with blue or yellow.
There are 4.12 hospitalizations for every 100k triple-vaxxed. This has nothing to do with red.
For simplicity.
Assume that there are 1,000,000 unvaxxed and 10,000,000 boosted.
The rates work out to 48.6 unvaxxed hospitalizations and 412 boosted hospitalizations. That is why you see such a huge difference in raw numbers (see previous post).
Obviously raw numbers without population size is useless. So to compare apples to apples, these numbers are standardized to a per 100k rate. That's why the 3 graphs are per 100k rates - to account for population share. Raw Hospitalizations / Cohort Size.
Next time, please make sure you take time to read the data source and understand the data before you get condescending.
Also - now that you understand the data better, I am still interested in your answers to my questions. If you still don't understand the per 100k charts, let me know, and I can create a graphic that illustrates it better for you.

 www.reuters.com