That was UKHSA's disclaimer that they added to the data in 2022 when the numbers started turning against the vax because they were concerned that the raw data would lead to vax hesitancy. we've previously discussed this here. This statement was not prevalent in 2021 when vax numbers looked good.
Numerous issues with the charts you posted:
- The ONS chart and CDC chart stop in Summer 2021, so they did not show the waning efficacy of the vax.
- For the record, UKHSA vax efficacy estimates were in alignment with CDC on ONS in the Summer of 2021. Then Delta arrived and changed the game.
- CDC and ONS started publishing regression-based adjustments but did not expose coefficients, code, or regression outputs for the adjustments, so the adjustments were opaque. UKHSA committed to publishing raw, unadjusted numbers.
- In order to generate the processed datasets, CDC would have had access to the raw data. But they never published the raw data - only the regression-adjusted data. Why?
- Oddly enough, UKHSA's data diverged from CDC on ONS. So much so, that UKHSA had to start issuing cautionary guidance stating that raw numbers do not indicate vax efficacy.
- Please explain that to me.
- Case in point: show the graphs of "vax efficacy" against infection from the same timeframe. Remember, the early day narrative shifted from "get vaxxed so you don't infect grandma" to " the vax was never meant to prevent infections, only to prevent severe impact and/or death"
- None of the charts are age stratified, violating foundational epidemiological principles for data analysis (and allowing confounders to hide and affect outcomes)
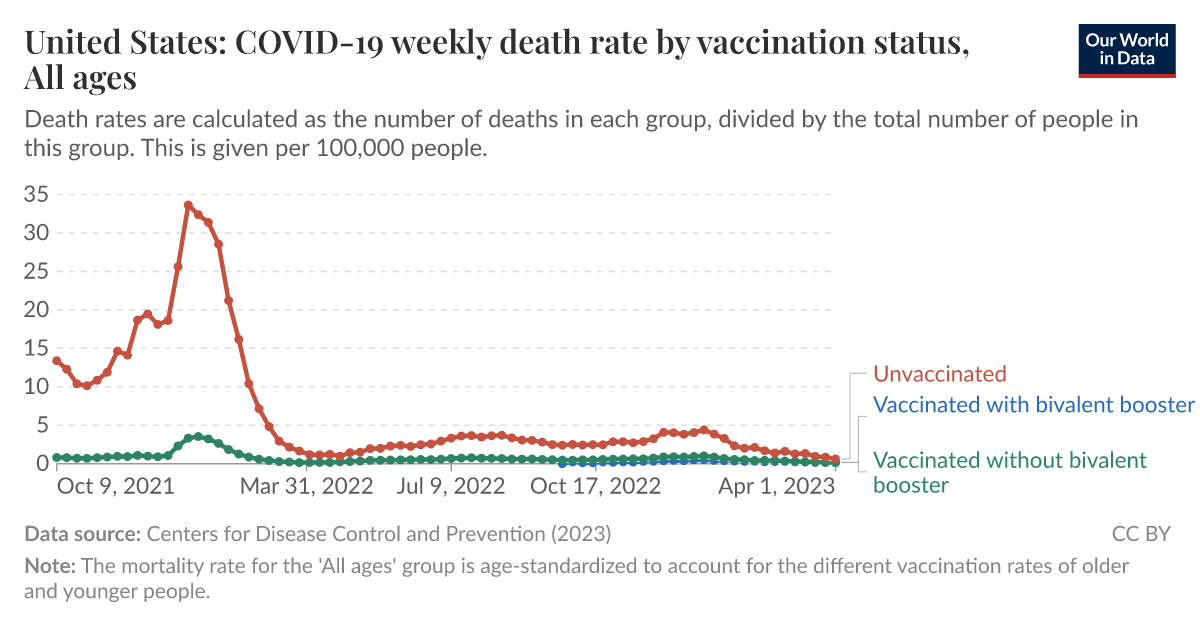
- The CDC chart is for hospitalizations, not death. We're discussing your statement insinuating that the vaxes saved "hundreds of thousands of lives"
- The "our world in data" chart did not provide raw data - it was a data product with zero transparency behind data aggregation (and that graph is highly aggregated)
- the last graph is just a model, fully dependent on a formula that modeled expected deaths without intervention. statistically, that is meaningless for causal inference.
As I've said before: find me a raw dataset similar to UKHSA's, with proper age stratification, and granular vax categories, and I'll gladly review and analyze. Otherwise, quit trying to pretend that opaquely processed data products are equivalent counterpoints.
And you have continually refused to consider it a valid data source, because of ~reasons~
No, I published the UKHSA data over numerous time periods throughout this thread, from 2021 through 2022. I even posted trends over t time, fully transparently. You can see each of those posts. I am just using the last data set they published because it is the most recent. If you want to go back and look at how vax efficacy changed over time, I have provided all of that analysis in this thread.
To be clear: I don't care why they stopped publishing the data. Regardless of the decision to stop publishing, the raw data is objective truth.
For some reason, you have never been curious to understand why CDC couldn't provide raw data with the granularity and quality of UK HSA, despite having a substantially larger budget, but you are willing to accept and post opaque CDC data products over raw, high-quality real-world data.
For someone who says they value data as a source of truth, you do a very poor job of recognizing the quality difference in raw data vs. opaque processed data products.
You posted processed data PRODUCTS and data models. Data products are generally inferior to raw data for analysis. That's inarguable. Data products 1) lack transparency, 2) limit causal inference, 3) potentially introduce processing bias, and 4) lose data granularity resulting in Simpson's paradox.
These are fundamental data analysis concepts that don't seem to bother you for some reason.